The National Safety Council (NSC) recently estimated that motor vehicle fatalities rose 9 percent in the first six months of 2016 compared to 2015, and 18 percent compared to 2014. At this rate, 2016 is shaping up to be the deadliest year for driving since 2007. This Labor Day weekend is on track to be the nation’s deadliest since 2008, with 438 fatalities projected over the three-day period.
The jump in traffic fatalities coincides with sinking gas prices and an uptick in driving. During the first half of 2016, U.S. motorists collectively drove 3.3 percent more compared to last year, reaching 1.58 trillion miles traveled. The recent upswing in miles driven has been linked to the availability of cheap gas and a sharp increase in traffic deaths.
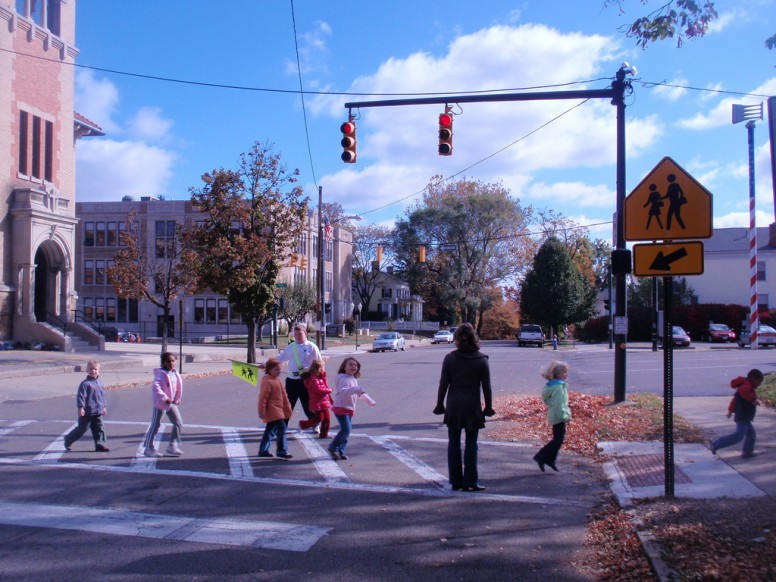
During the first six months of 2016, roughly 19,100 people were killed on U.S. roads–enough to fill 382 school buses. With back-to-school season already in full swing, it’s a good time to remember that just 13 percent of kids between ages 5 and 14 walk or bike to school. Many families have cited traffic-related concerns as barriers influencing their decision to prohibit their child from walking or biking to school. Streets designed to prioritize the safety of people walking and biking, then, are critical to encouraging more families and students to choose active transportation.
Pedestrians and bicyclists already account for more than one in four traffic deaths in New York and New Jersey, and fifteen percent in Connecticut. In New Jersey alone, traffic deaths surged 12 percent during the first half of 2016. The number of bicyclists killed in New York City so far in 2016 has already exceeded the total number of fatalities in 2015.
The need for safer streets is clear, but not every community is answering the call. Howell Township in New Jersey recently justified eliminating several crossing guard positions since few students walked to school. The Howell Superintendent Joseph Isola defended the cuts, saying the township was already doing enough to ensure students got “from the sidewalk to the building safely.”
These types of budget cuts, however, won’t do much to protect students walking farther than that sidewalk, nor will it encourage any more students to walk. Kids who walk or bike to school have a lower risk for obesity and perform better academically. Investing in safer streets will not only help students long after they’ve graduated; it is critical to curbing the alarming recent rise in traffic deaths.
Celebrate the region’s biggest and boldest recent transportation initiatives at TSTC’s 2016 Benefit on September 27. Get your tickets here.
We need to make sure that we are doing a apples to apples comparison and not a apple to a orange. Comparing 2016 and 2015 to 2014 to 2008 years is misleading because they were RECESSION YEARS!
The increase is economic. The recession years depressed driving, in particular DUI, younger drivers, and less discretionary (travel) driving.
The last boom year (not counting 2015), was 2007, where then we drove a record number of miles.
http://www-fars.nhtsa.dot.gov/Main/index.aspx
In the 2007 US deaths were 41,259 which was at the time the biggest driving year till 2015.
2015 deaths are LOWER! And if the 19,100 6 months number, will be lower than 2007 despite even more miles driven than 2015 in 2016.
It is really important to NOT compare 2016 or 2015 to the recession years as any comparison to 2008 to 2014 numbers SKEW the results due the recession affecting the numbers.
Here are 2006 thur 2014.
http://www-fars.nhtsa.dot.gov/Main/index.aspx
2006 US Death rate per mile 1.42 Total Deaths 42,708 Miles Driven 3.014 Trillion (3,014 VMT Billion)
2007 US Death rate per mile 1.36 Total Deaths 41,259 Miles Driven 3.031 Trillion
Recession Begins
2008 US Death rate per mile 1.26 Total deaths 37,423. Miles Driven 2.977 Trillion (2,977 VMT Billion)
Full year of recession
2009 US Death rate per mile 1.15 Total deaths 33,883. Miles Driven 2.957 Trillion
2010 US Death rate per mile 1.11 Total deaths 32,999. Miles Driven 2.967 Trillion
2011 US Death rate per mile 1.10 Total deaths 32,479. Miles Driven 2.950 Trillion
2012 US Death rate per mile 1.14 Total deaths 33,782. Miles Driven 2.969 Trillion
2013 US Death rate per mile 1.10 Total deaths 32,894. Miles Driven 2,988 Trillion
Starting to leave Recession
2014 US Death rate per mile 1.08 Total deaths 32,675. Miles Driven 3.026 Trillion (3,026 VMT Billion)
Also note that a lot of the deaths in places like AL had a high percentage of people NOT WEARING seat belts too. Couple that with more miles, more likely DUI and younger drivers, that is why it is higher also than the recession years.
Also it would be helpful if NSC would also use the DEATH RATE per mile as it takes into account the miles driven too. 2015 was 1.12, thought higher than 2014 and 2013, was lower than 2012.
Again we are dealing with an economic increase and the effects of that. When the next recession hits, and DUI, younger drivers, and discretionary driving drops so will the deaths.
[…] Kilkelly at Mobilizing the Region reports on newly-released data from the first half of 2016 showing a disturbing increase in […]
[…] Sharp rise in 2016 traffic fatalities should renew calls for safer streets (TSTC) […]
[…] Kilkelly at Mobilizing the Region reports on newly-released data from the first half of 2016 showing a disturbing increase […]
[…] Kilkelly at Mobilizing the Region reports on newly-released data from the first half of 2016 showing a disturbing increase […]
[…] National Safety Council estimates 2016 to have 9% more fatalities then this time last year and 18% more fatalities then two years ago. This year could have the most American fatalities in nearly a decade, with an estimated 438 fatalities for this upcoming Labor Day weekend alone. […]
[…] the US rebounded to levels unseen since 2008. Halfway through 2016, motor vehicle fatalities were up again by 9 percent, as drivers have taken advantage of the lowest gas prices in over a decade. In a new report, the […]