Tri-state region pedestrians aged 60 years and older are disproportionately at risk of being killed in collisions with vehicles while walking, according to a new study by the Tri-State Transportation Campaign.
From 2003 through 2012, 1,492 pedestrians aged 60 years and older were killed on Connecticut, New Jersey and downstate New York roads, according to Older Pedestrians at Risk: A Ten Year Survey and Look Ahead, released today. The report found that:
- Those 60 and older comprised only 18 percent of the region’s population, but accounted for 35 percent of pedestrian fatalities during the 10-year period
- Those aged 75 years and older represent 6 percent of the tri-state region’s population, but 16.5 percent of pedestrian deaths.
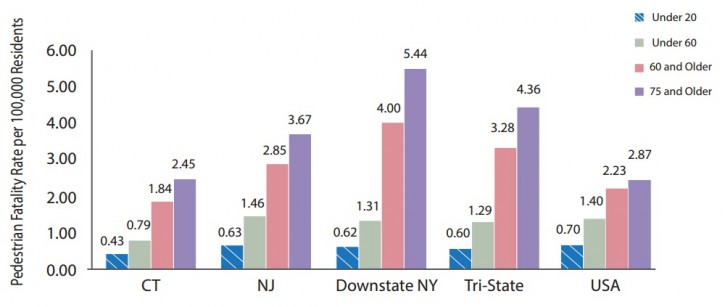
- The pedestrian fatality rate for the region’s residents 60 and older is 2.5 times higher than that of residents under 60.
- For residents 75 and older, the pedestrian fatality rate is more than three times that of those under 60.
Tri-State Average Pedestrian Fatality Rate by Age Group (2003-2012)

According to AARP, decreased bone density exacerbates injuries sustained by seniors. Coupled with mobility issues that hinder their ability to cross a road quickly, this age group is particularly prone to critical injuries from car collisions. However, simple roadway improvements – clearly marked crosswalks, longer crossing signals and wider pedestrian islands – make walking safer and easier for older residents and younger residents alike.
Tri-State’s analysis also found that the tri-state region is far more dangerous for older pedestrians than the rest of the country. The pedestrian fatality rate for people 60 years and older living in Connecticut, New Jersey and downstate New York was 54.5 percent higher than for the rest of the country, and those 75 years and older suffered a fatality rate that was 60.1 percent higher.
In 10 years, the share of the region’s residents 60 and older increased from 17 percent of the population to 19.4 percent— 2.4 percentage points.
Tri-State’s research showed that Manhattan had the highest average older pedestrian fatality rate of all tri-state counties. Of Manhattan’s 364 pedestrian fatalities, 155 were pedestrians 60 or over. Nassau County on Long Island, Brooklyn and Atlantic County in New Jersey also had particularly high older pedestrian fatality rates. The chart below ranks the 41 tri-state counties by older pedestrian fatality rates:
| Rank | County | Older (60+ years) Pedestrian Fatalities, 2003-2012 | Avg. Older Pedestrian Fatality Rate per 100,000* (2003-2012) | Avg. Younger (under 60 years) Pedestrian Fatality Rate per 100,000* (2003-2012) |
| 1 | Manhattan, NY | 155 | 5.46 | 1.49 |
| 2 | Nassau County, NY | 142 | 5.17 | 1.49 |
| 3 | Brooklyn, NY | 202 | 4.94 | 1.23 |
| 4 | Atlantic County, NJ | 24 | 4.58 | 3.26 |
| 5 | Bronx County, NY | 79 | 3.94 | 1.16 |
| 6 | Passaic County, NJ | 32 | 3.89 | 1.44 |
| 7 | Mercer County, NJ | 24 | 3.85 | 1.33 |
| 8 | Hudson County, NJ | 35 | 3.83 | 1.19 |
| 9 | Queens County, NY | 152 | 3.75 | 1.11 |
| 10 | Essex County, NJ | 47 | 3.72 | 2.01 |
| 11 | Staten Island, NY | 29 | 3.57 | 1.18 |
| 12 | Union County, NJ | 32 | 3.47 | 1.95 |
| 13 | Putnam County, NY | 6 | 3.46 | 1.33 |
| 14 | Middlesex County, NJ | 44 | 3.32 | 1.54 |
| 15 | Bergen County, NJ | 58 | 3.18 | 1.02 |
| 16 | Camden County, NJ | 28 | 3.11 | 1.60 |
| 17 | Suffolk County, NY | 81 | 2.99 | 2.23 |
| 18 | Ocean County, NJ | 38 | 2.47 | 1.55 |
| 19 | Gloucester County, NJ | 12 | 2.44 | 1.10 |
| 20 | New London County, CT | 12 | 2.39 | 1.10 |
| 21 | Rockland County, NY | 13 | 2.38 | 1.14 |
| 22 | Cumberland County, NJ | 6 | 2.24 | 1.80 |
| 22 | Monmouth County, NJ | 26 | 2.24 | 1.29 |
| 24 | Litchfield County, CT | 9 | 2.22 | 0.13 |
| 25 | Orange County, NY | 12 | 2.21 | 1.10 |
| 26 | Tolland County, CT | 5 | 2.00 | 0.80 |
| 27 | Westchester County, NY | 36 | 1.98 | 0.68 |
| 28 | Fairfield County, CT | 31 | 1.91 | 0.60 |
| 29 | New Haven County, CT | 30 | 1.85 | 0.99 |
| 30 | Dutchess County, NY | 9 | 1.77 | 0.54 |
| 31 | Hartford County, CT | 30 | 1.74 | 0.89 |
| 32 | Burlington County, NJ | 14 | 1.69 | 1.68 |
| 33 | Salem County, NJ | 2 | 1.61 | 1.72 |
| 34 | Morris County, NJ | 13 | 1.49 | 0.96 |
| 35 | Cape May County, NJ | 4 | 1.44 | 1.98 |
| 35 | Windham County, CT | 3 | 1.44 | 0.63 |
| 37 | Somerset County, NJ | 7 | 1.28 | 0.94 |
| 38 | Hunterdon County, NJ | 3 | 1.27 | 1.03 |
| 39 | Warren County, NJ | 2 | 1.02 | 0.90 |
| 40 | Middlesex County, CT | 3 | 0.85 | 0.70 |
| 41 | Sussex County, NJ | 2 | 0.76 | 0.25 |
*Fatality rates are calculated according to the population of the relevant age group (i.e., population aged 60 years and older, population under 60 years).
Communities across the region are making it easier and safer for older adults to walk. However, more can and should be done. In addition to the report’s state-specific recommendations (CT, NJ, NY), the report calls for state departments of transportation to adopt the National Association of City Transportation Officials’ (NACTO) Urban Street Design Guide, which provides guidance on street designs that safely accommodate all road users, including pedestrians, bicyclists and transit riders. Currently, the Federal Highway Administration, 37 cities (including New York City), and six states have adopted NACTO standards, but New York State, New Jersey and Connecticut are yet to follow suit.

Street design gudielines are important, but in built up areas there a few new streets and generally there is little money available to retrofit very many exiisting ones. Therefore I think more attention needs to be on highway safety laws (speed limits, enforcement cameras, penalties for careless motorsts that kill or injure someone…) and their enforcement.
[…] its latest annual “Older Pedestrians at Risk” report, Tri-State analyzed 10 years of metro area data from the Census Bureau and the National […]
[…] Representative David Kooris – In response to Tri-State’s Older Pedestrians at Risk analysis, the newly-elected City of Stamford representative intends to “propose an ordinance […]
[…] study found that although people in this age group comprised only 18 percent of the region's […]