As the Federal Highway Trust Fund inches closer to bankruptcy and the Obama Administration’s transportation funding plan remains a work in progress with MAP-21 expiring at the end of FY 2014, the reality remains that the nation’s infrastructure is in pretty bad shape.
With money tight and needs large, prioritization is key. But, unfortunately, that’s not how things get done in Washington. Once the gas tax and other funds are collected by the federal government, they are deposited in the Highway Trust Fund. The Fund is then split into the Highway Account and Mass Transit Account.
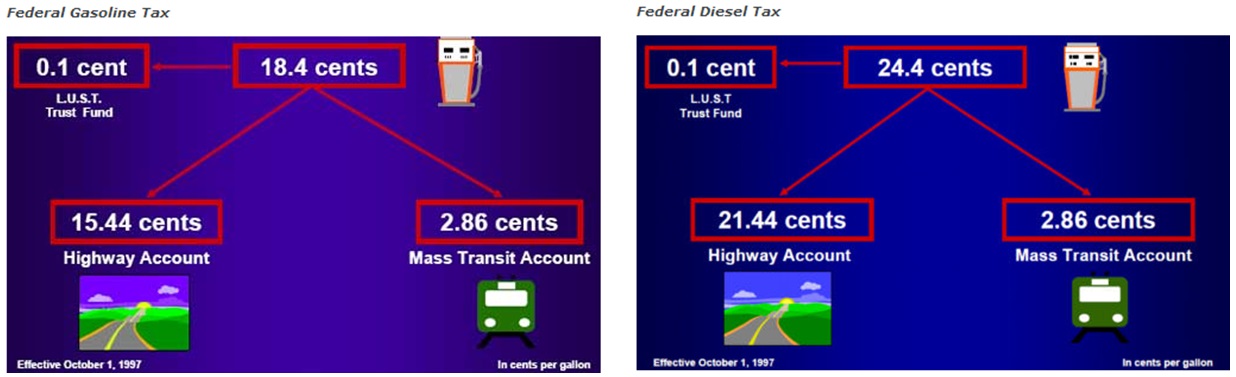
This funding breakdown highlights that only a small percentage of the two largest transportation funding pots go to mass transit funding, a key component of mobility in large metro areas. Even less goes toward infrastructure for walking and biking — the kind of infrastructure that’s integral for creating livable cities where people want to live – even though recent data show that these transportation modes are gaining users while vehicle miles traveled declines or is steady. Once the funds are generated, they are then seemingly arbitrarily distributed throughout the country, with distribution breakdowns based on apparent but not actual need based criteria.
Federal Highway Administration funding formulas by program, fiscal year 2010:
| Fund | Factors |
Weight |
| Interstate Maintenance (IM) | Interstate System lane milesVehicle miles traveled on the Interstate System
Annual contributions to the Highway Account of the Highway Trust Fund attributable to commercial vehicles |
33.33% 33.33% 33.33% |
| National Highway System (NHS) | Lane miles on principal arterial routes (excluding Interstates)Vehicle miles traveled on principal arterial routes (excluding Interstates)
Diesel fuel used on highways Total lane miles on principal arterials divided by the State’s total population |
25% 35% 30% 10% |
| Surface Transportation Program (STP) | Total lane miles of Federal-aid highwaysTotal vehicle miles traveled on Federal-aid highways
Estimated tax payments attributable to highway users paid into the Highway Account of the Highway Trust Fund |
25% 40% 35% |
| Bridge Replacement and Rehabilitation Program (BRR) | Relative share of total cost to repair or replace deficient bridges |
100% |
| Congestion Mitigation and Air Quality Improvement Program (CMAQ) | Weighted nonattainment and maintenance area population |
100% |
| Highway Safety Improvement Program (HSIP) | Total lane miles of Federal-aid highwaysTotal vehicle miles traveled on Federal-aid highways
Number of fatalities on the National Highway system |
33.33% 33.33% 33.33% |
| Railway – Highway CrossingsSafe Routes to School Program | Formula used for Surface Transportation ProgramTotal number of public railway-highway crossings
Total School enrollment in primary and middle schools (grades K-8) |
50% 50% 100% |
| Recreational Trails Program | Equal shares to each eligible StateNonhighway recreational fuel use during the preceding year |
50% 50% |
| Metropolitan Planning (MP)Coordinated Border Infrastructure Program | Urbanized area population*Incoming commercial trucks passing through land border ports of entry
Incoming buses and personal vehicles passing through land border POEs Total weight of incoming cargo passing through land border POEs Total number of land border POEs within boundaries of border states |
100% 20% 30% 25% 25% |
| Equity Bonus | Each States share of High Priority Projects funding and apportionments for IM, NHS, STP, BRR, CMAQ, HSIP, Safe Routes to Schools, Highway Railway Crossing, MP, RT, Coordinated Border Infrastructure, Appalachian Development, and Equity Bonus must be at least a specified share (currently 92%) of its estimated payments into the Highway Account of the Highway Trust Fund or for certain States, no less than the share of High Priority Project funding and apportionments it received under TEA-21, except that no State may receive an amount less than the specified percentage (currently 121%) of the average annual amount it received in apportionments and High Priority Projects under TEA-21. |
100% |
| Appalachian Development Highway System | Latest available cost-to-complete estimates under section 14501 of Title 23, U.S.C. |
100% |
(Source: Donna Cooper and John Griffith, Highway Robbery, How Congress Put Politics Before Need in Federal Highway and Transit Funding, October 2012)
What’s clear is that, although MAP-21 provides money to specific funding programs, which are then distributed to states at amounts in line with levels from previous transportation bills, these funding levels don’t align well with real transportation “needs.”
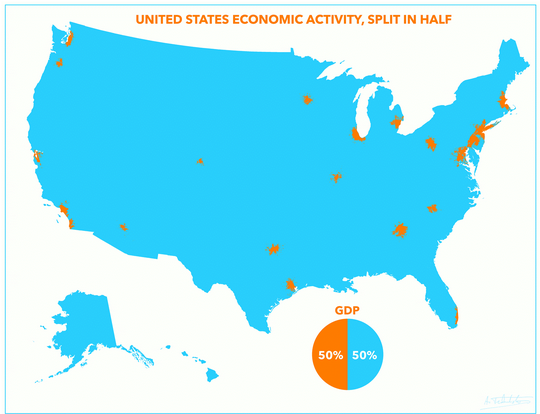
The problem, of course, is that project need and return on investment is rarely incorporated in funding allocation decisions. Instead of continuing the legacy of these past distribution policies — which provided more funding in return for more lane miles and VMT — policy makers should consider greater funding priority for areas that serve as major economic generators, like urban centers and their metropolitan suburbs. The ten largest metropolitan areas, which account for a quarter of the nation’s total population, produce more than a third of the national GDP. Taking a more visual approach, it is easy to see how vital metropolitan regions are to the economic vitality of the country:
This trend is only going to get stronger with a continued population and employment shift toward metropolitan areas. Study after study have shown that millennials want to move to cities where there are multiple transportation options available. At the same time research suggests that an increasing share of employment is shifting to city centers.
But as this shift continues, will the federal government adapt to these 21st century challenges, or continue business as usual? If the engines of our GDP are going to continue to flourish, federal transportation funding decisions must consider the productivity and return on investment when distribution decisions are made, regardless of the source of the funds. Upgrading the transportation infrastructure—the transit systems, sidewalks and bike lanes—that allow for businesses, residents and visitors to thrive, should be priority number one.
[…] The NYSDOT design manual must be updated to address 21st century planning realities and shifting demographic demands. Several participants also noted that NYSDOT had not endorsed NACTO’s Urban Street […]
[…] These seven states and D.C. are home to 56.5 million people or 18 percent of the nation’s entire population, and in 2014, accounted for 52.6 percent of all transit riders in the United States. The dense northeast corridor region, which includes portions of these eight jurisdictions, generates roughly 20 percent of the nation’s entire gross domestic product. […]