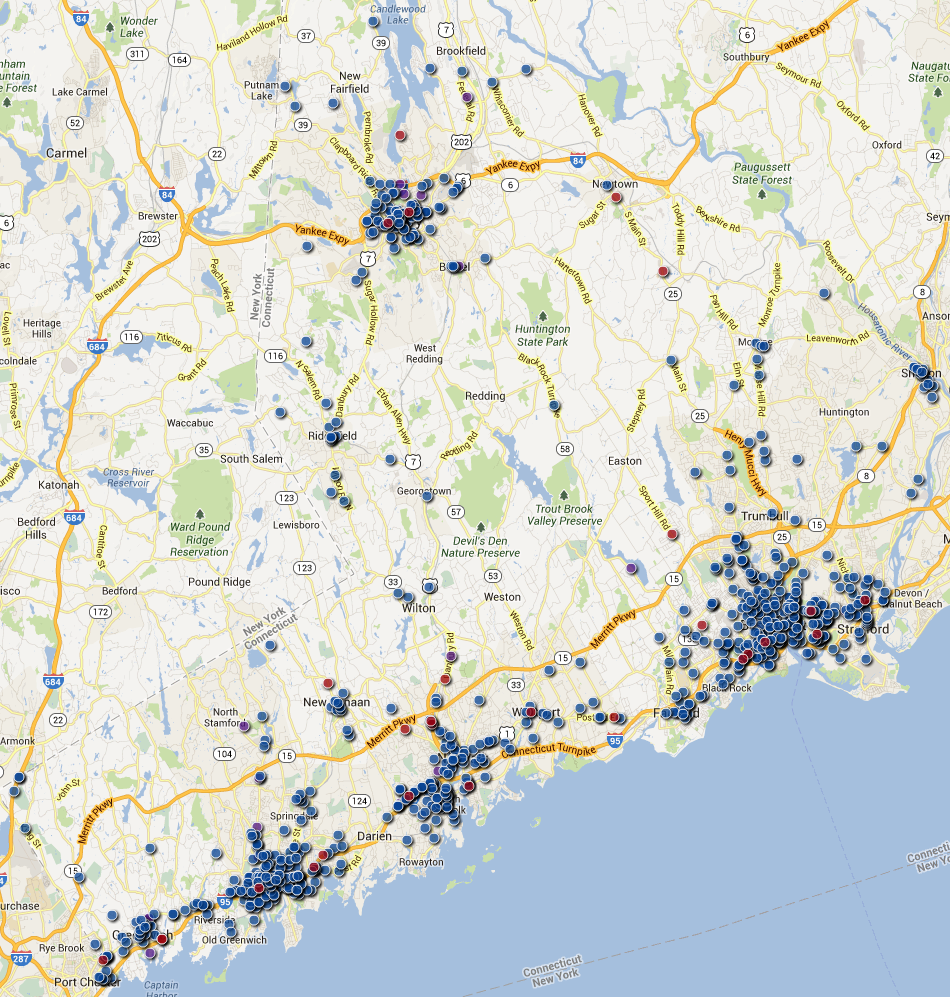
Thanks to data recently made available by the Connecticut Departments of Public Safety and Transportation via the University of Connecticut Crash Data Repository, TSTC was able to map and analyze both pedestrian deaths and injuries in Connecticut for the first time.
The Fairfield County Pedestrian Crash Analysis found that during the three-year period from January 1, 2010 to December 31, 2012, there were 1,022 vehicle crashes involving pedestrians in Fairfield County, Connecticut. Of those crashes, 951 resulted in injuries, and 28 were confirmed fatal. These crashes resulted in a total of 1,077 pedestrian injuries and 34 deaths.
In addition to mapping the locations of these crashes, the analysis also identifies the five most dangerous roads in the county: US Route 1 topped the list with 169 pedestrian crashes, followed by CT Route 130 (43), CT Route 137 (30), Main Street in Bridgeport (30), and CT Route 127 (29). Building off TSTC’s Most Dangerous Roads analysis released earlier this month, the Fairfield analysis found that the County’s most dangerous roads share common characteristics of dangerous arterial roads that were identified throughout the region—wide, multi-lane roads that enable high speeds and have little to no pedestrian infrastructure.
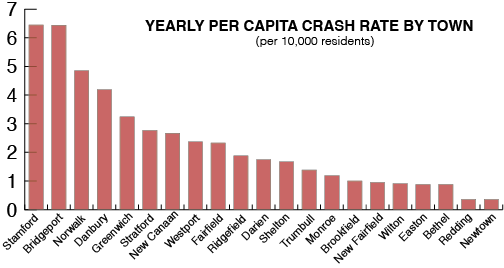
The Fairfield County analysis highlights the critical need to create safer streets for pedestrians in southwestern Connecticut, especially in dense, urban areas. Stamford had the highest yearly per capita crash rate of all municipalities in the county (6.45 per 10,000 residents), along with the most pedestrian crashes along US Route 1 (51). Bridgeport had a yearly per capita crash rate of 6.44, and saw the most pedestrian crashes across all municipalities (281).
Connecticut is known to have one of the strongest state complete streets laws in the country, but a law is only as effective as the agencies who implement it. In Fairfield County, more must be done to ensure safe streets for pedestrians, cyclists and drivers alike.
Fortunately, planning organizations in the area, like the South Western Regional Planning Agency (SWRPA) and the Greater Bridgeport Regional Council (GBRC), are taking steps in the right direction. SWRPA conducted studies for parts of US Route 1 in Greenwich/Stamford and Darien, and their recommendations include road diets, bike lanes, back-angle parking, roundabouts and more. GBRC completed a complete streets study for Bridgeport and a bicycle/pedestrian master plan for the Town of Fairfield, which included recommendations such as curb extensions and new crosswalks. In addition, The Connecticut Department of Transportation (ConnDOT) recently made spot improvements in Westport, and is seeking funds to add sidewalks in Stratford.
Still, more collaboration between state and local leaders is needed to balance needs and safety for all users of the road. Tri-State recommends that:
- ConnDOT update the state’s Highway Design Manual, the standard road design reference book, to address the goals and policies set forth in the state’s complete streets law
- state and local leaders fund corridor studies of dangerous roads like Routes 1, 130, 137, and 127 and implement recommendations of existing studies, such as those completed by SWRPA and GBRC
- the State Legislature pass a vulnerable users bill which would increase penalties for careless drivers who injure or kill pedestrians, cyclists, first responders and other users of the road who are most at risk
- municipal governments pass complete streets policies requiring that local roads are safely designed for everyone who uses them.
The analysis, which includes county- and town-specific stats, a series of factsheets on Route 1, and a map of all 1,022 pedestrian crashes, is available here.