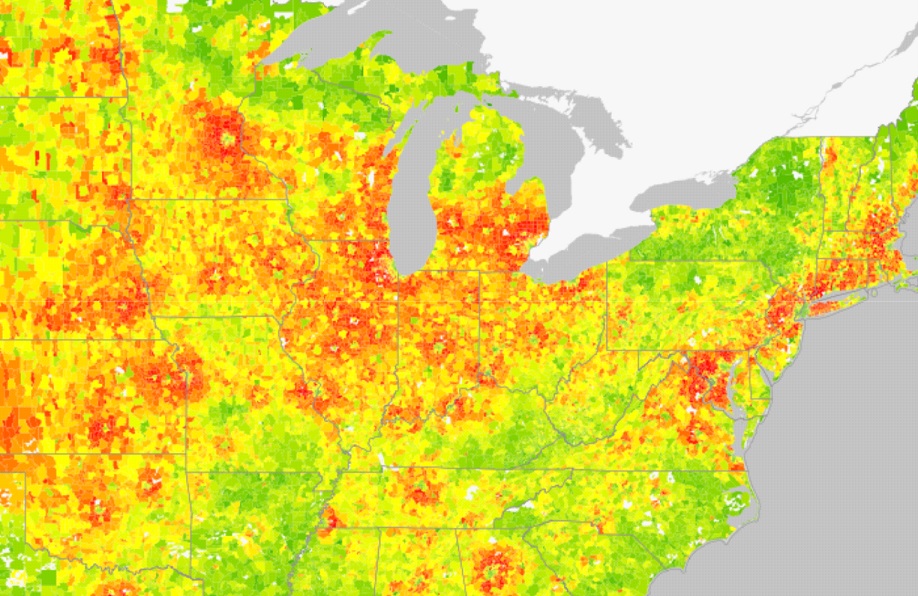
The findings of a recent University of California, Berkeley study serve as yet another stark reminder that the suburban sprawl model of development is unsustainable. The report and corresponding interactive map, compiled by the CoolClimate Network , a division of UC Berkeley’s Renewable and Appropriate Energy Laboratory, calculate the carbon emissions for the average household in almost every United States zip code – with dark green indicating comparatively low emissions, moving up to light green, yellow, orange and then red indicating the highest concentration of emissions.
The researchers discovered that
Metropolitan areas look like carbon footprint hurricanes, with dark green, low-carbon urban cores surrounded by red, high-carbon suburbs. Unfortunately, while the most populous metropolitan areas tend to have the lowest carbon footprint centers, they also tend to have the most extensive high-carbon footprint suburbs.
This is easy to see on the map (right), with many small green circles (urban centers) surrounded by red rings (suburbs). Two key drivers of this phonomenon are emissions from transportation and housing. For example, in the tri-state region:
|
Metric Tons of CO2 Equivalent Per Year by Type (apprx.) |
|||||
| Location/Zip |
Transportation |
Housing |
Food |
Goods |
Services |
| Manhattan, NY 10014 |
5 |
8 |
4 |
6 |
7 |
| Paramus, NJ 07652 |
19 |
17 |
9 |
7 |
8 |
| East Meadow, NY 11554 |
17 |
18 |
8 |
6 |
7 |
The local examples show that the overall difference in carbon emissions is due mostly to transportation and housing. Paramus and East Meadow, two car-dependent suburbs outside of New York City, have three times the transportation emissions and twice the housing emissions of the region’s urban core. The study also determined that if new development is single-family attached or multi-family homes (as opposed to single-family detached homes), even more energy consumption and carbon emissions reductions can be realized.
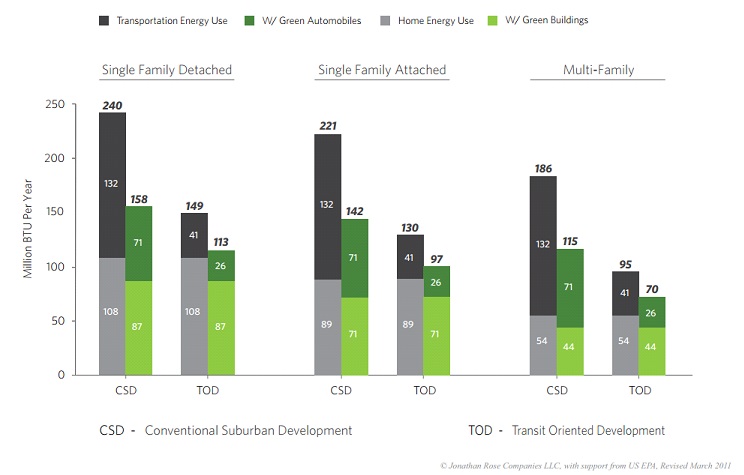
It’s clear that to reverse this trend is to rethink development patterns in the region’s suburbs and focus development near transit hubs and in walkable and bikeable downtowns and Main Streets. Not only will this reduce greenhouse gas emissions, it will create more affordable housing, and support communities that are increasingly in demand from young families and aging baby boomers.
[…] Nobody doubts that Carlucci wants to do what’s in the best interests of his constituents, but a toll subsidy for motorists is the last thing his constituents and New Yorkers need. Adding incentives for driving through reduced toll costs will only add to the congestion that is a growing problem in Rockland County — not to mention negative environmental, economic and quality of life impacts that come with choosing driving over tr…. […]