As winter arrives in New York City, and before Citi Bike naysayers start complaining that no one will ride Citi Bike as the days get colder, TSTC took a look at other comparable bike share systems throughout the world to see how bike share usage ebbed and flowed with the seasons.
While each city and program is different (e.g. system size, rollout timing and population densities), and without attempting to forecast outcomes for New York City, TSTC looked at first year bicycle trips of London’s Barclays Cycle Hire and Washington D.C.’s Capital Bikeshare (CaBi) to see if these systems may shed some light on the myriad of factors that impact a bike share program’s ridership.
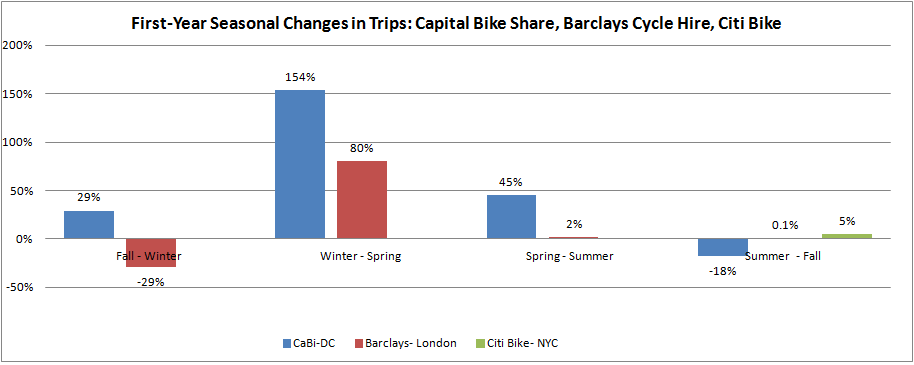
According to TSTC’s analysis, common assumptions — such as a drop in ridership from fall to winter — don’t always hold up. While Barclays Cycle Hire saw a decrease in the average [1] monthly number of trips from fall to winter in its first year, CaBi actually experienced an increase. Two possible reasons for CaBi’s increase may have been a warm D.C. winter, or that the program was still gaining momentum from its fall launch.
Similarly, one might expect ridership to either decrease or stay flat from summer to fall, but Citi Bike and Barclays both saw increases in average monthly trips. Citi Bike’s 5 percent increase, comparable to CaBi’s fall to winter increase, might also have to do with the timing of Citi Bike’s launch; bike share in New York City, barely six months old now, is still gaining momentum.
The biggest change in ridership witnessed so far has been the huge increases in average monthly number of trips from the winter to the spring for both Barclays and Capital Bikeshare. CaBi’s average number of monthly trips jumped 154 percent from winter to spring and Barclays jumped 80 percent. This suggests that even if a program does see a decrease in the number of trips taken during the winter, ridership is likely to bounce back strong in the spring.
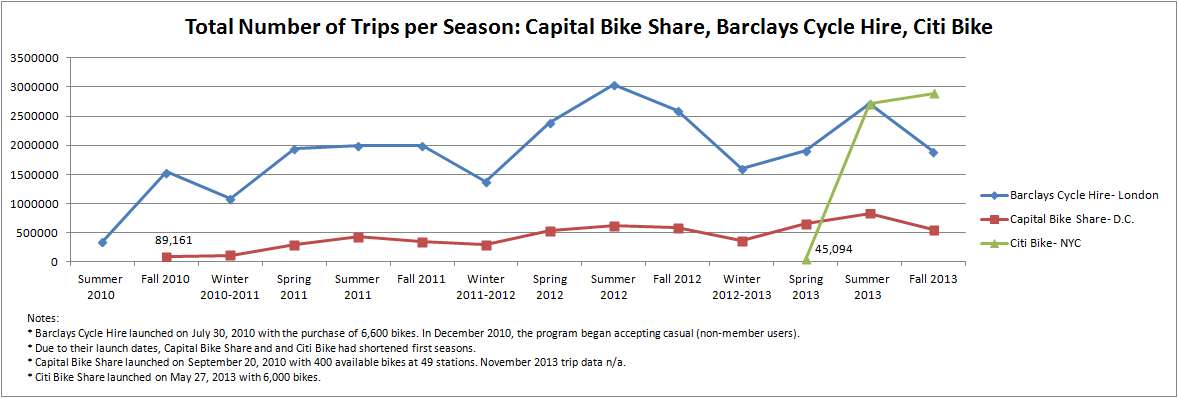
TSTC also looked at all trips for each system by season to see how seasonal changes played out in the programs’ second and third years. The number of trips in second and third years tends to drop from fall to winter and from summer to fall, unlike in CaBi’s and Barclays’ first years. More importantly, however, is that CaBi and Barclays saw significant ridership increases from winter to spring in their second and third years.
So what does looking at the seasonal trips taken by bike share program users in New York, London and D.C. tell us? Well, certainly to expect seasonal ridership changes, but just because ridership dips in the winter doesn’t suggest there is waning interest. In fact, given what we’ve seen in London and DC, ridership should be back larger than anticipated when the weather warms up.
[1] To find seasonal average, TSTC added up each season’s three months of trip data and divided by three to determine the “average month” for the season.
Here in DC over the past few winters the seasonal usage dip was offset by improved system fluidity — stations were less likely to run out or fill up.
In previous years Capital Bikeshare has run Winter Weather Warrior promotional contests to encourage subscribers to keep riding – top users earned prizes including free membership extensions.
[…] a Jump on the Tabloids, Tri-State Analyzes Seasonal Bike-Share […]
[…] to stay open year round preserves a much-needed mobility choice for New Yorkers, which seems to be bucking conventional wisdom of a drop off in ridership from warm to cooler seasons. Citi Bike ridership increased by 5 percent […]