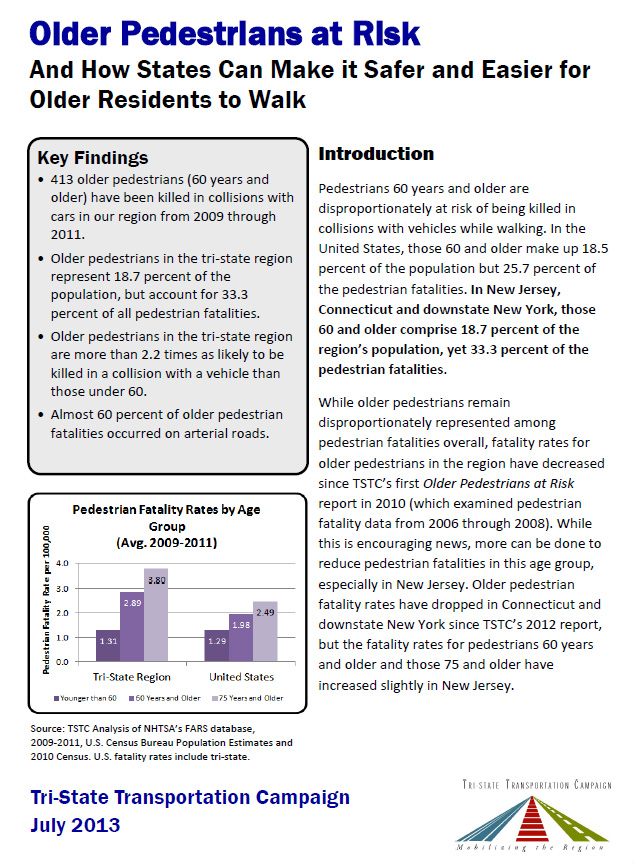
 Pedestrians 60 years and older in the tri-state region are disproportionately at risk of being killed in collisions with vehicles while walking, according to TSTC’s annual “Older Pedestrians at Risk And How States Can Make it Safer and Easier for Older Residents to Walk” report. This year’s report examines pedestrian fatality data from 2009 through 2011 and finds that 413 pedestrians 60 and older were killed in collisions with vehicles during the study period. Older pedestrians represent just 18.7 percent of the tri-state area population but account for 33.3 percent of the region’s pedestrian fatalities. The fatality rate for pedestrians 60 years and older in the tri-state region is more than 2.2 times higher than the fatality rate for pedestrians under 60. Pedestrians 75 and older have a fatality rate 2.9 times higher than that of pedestrians under 60.
The report notes that the tri-state region’s overall older pedestrian fatality rate has dropped since TSTC’s first Older Pedestrians at Risk report in 2010, which examined pedestrian fatality data from 2006 through 2008. Looking at the rates of individual states, however, older pedestrian fatality rates increased in New Jersey from last year’s report, but they dropped in both downstate New York and Connecticut.
The aging of the Baby Boomer generation necessitates that roads in our region be redesigned to accommodate the needs of older pedestrians. Road improvements that make roads safer and easier for older pedestrians to cross – such as curb ramps, well-marked crosswalks, pedestrian crossing islands and pedestrian countdown signals – also help pedestrians of all ages, from parents with small children to teenagers.
The tri-state region continues to move ahead on pedestrian safety initiatives and improvements, but with over 1,240 pedestrians killed in the three years from 2009 through 2011, more must be done.
To create roads that are safer for pedestrians, bicyclist and motorists alike, the report offers recommendations for state agencies, legislatures, municipalities and counties in each state. The full report, and fact sheets broken out by county, can be downloaded here.
Most Dangerous Counties for Older Pedestrians **
| Rank | County | Older (60+ yrs) Pedestrian Fatalities (2009-2011) | Avg. Older Pedestrian Fatality Rate per 100,000 * (2009-2011) | Avg. <60 yrs Pedestrian Fatality Rate per 100,000 * (2009-2011) | Rank in 2008-2010 |
|
1 |
Putnam County, NY |
3 |
5.44 |
2.05 |
11 |
|
2 |
Hudson County, NJ |
14 |
4.98 |
1.45 |
5 |
|
3 |
Bronx County, NY |
30 |
4.78 |
1.35 |
6 |
|
4 |
Passaic County, NJ |
12 |
4.64 |
0.97 |
10 |
|
5 |
Nassau County, NY |
39 |
4.56 |
1.38 |
2 |
|
6 |
Essex County, NJ |
16 |
4.14 |
2.05 |
7 |
|
7 |
Queens County, NY |
51 |
4.13 |
1.29 |
3 |
|
8 |
Brooklyn, NY |
51 |
4.05 |
1.18 |
4 |
|
9 |
Manhattan, NY |
35 |
3.87 |
1.40 |
7 |
|
9 |
Bergen County, NJ |
22 |
3.87 |
0.89 |
13 |
|
11 |
Union County, NJ |
9 |
3.15 |
1.83 |
15 |
|
12 |
Litchfield County, CT |
4 |
3.08 |
0.00 |
1 |
|
13 |
Mercer County, NJ |
6 |
3.06 |
1.44 |
23 |
|
14 |
Atlantic County, NJ |
5 |
3.02 |
3.36 |
18 |
|
15 |
Middlesex County, NJ |
12 |
2.84 |
1.46 |
19 |
|
16 |
Camden County, NJ |
8 |
2.83 |
1.82 |
9 |
|
17 |
Ocean County, NJ |
12 |
2.53 |
2.07 |
14 |
|
18 |
Burlington County, NJ |
6 |
2.26 |
1.02 |
27 |
|
19 |
Suffolk County, NY |
17 |
1.96 |
2.56 |
24 |
|
20 |
Fairfield County, CT |
10 |
1.92 |
0.58 |
26 |
|
21 |
Staten Island, NY |
5 |
1.89 |
1.38 |
21 |
|
22 |
Monmouth County, NJ |
7 |
1.87 |
1.24 |
30 |
|
23 |
Rockland County, NY |
3 |
1.68 |
0.80 |
36 |
|
24 |
Orange County, NY |
3 |
1.66 |
1.15 |
20 |
|
25 |
Warren County, NJ |
1 |
1.60 |
0.76 |
31 |
|
26 |
Windham County, CT |
1 |
1.48 |
1.04 |
29 |
|
27 |
Westchester County, NY |
8 |
1.40 |
0.57 |
25 |
|
28 |
Hunterdon County, NJ |
1 |
1.30 |
1.26 |
Not ranked |
|
28 |
Gloucester County, NJ |
2 |
1.30 |
1.12 |
16 |
|
30 |
Hartford County, CT |
7 |
1.28 |
0.85 |
22 |
|
31 |
Tolland County, CT |
1 |
1.25 |
1.06 |
33 |
|
32 |
New London County, CT |
2 |
1.21 |
1.08 |
35 |
|
33 |
Morris County, NJ |
3 |
1.06 |
0.84 |
32 |
|
34 |
Middlesex County, CT |
1 |
0.89 |
0.77 |
Not ranked |
|
35 |
New Haven County, CT |
4 |
0.78 |
1.07 |
17 |
|
36 |
Somerset County, NJ |
1 |
0.58 |
0.62 |
28 |
|
36 |
Dutchess County, NY |
1 |
0.58 |
0.56 |
12 |
Tri-State Pedestrian Fatalities, 2009-2011
|
State |
Pedestrian Fatalities (2009-2011) |
Older (60+ yrs) Pedestrian Fatalities (2009-2011) |
Avg. Older Pedestrian Fatality Rate per 100,000* |
|
Connecticut |
100 |
30 |
1.41 |
|
New Jersey |
440 |
137 |
2.73 |
|
Downstate New York |
702 |
246 |
3.43 |
|
Tri-State |
1,242 |
413 |
2.89 |
Source: TSTC Analysis of NHTSA’s FARS database, 2008-2010, U.S. Census Bureau Population Estimates and 2010 Census. *Fatality rates are calculated according to the population of the relevant age group (i.e., population aged 60 years and older, population under 60 years). ** Counties with no older pedestrian fatalities (Cape May, Cumberland, Salem and Sussex) are not included.
[…] See the original article here: New Tri-State Report Finds Region's Older Pedestrians at Risk … […]
[…] Tri-State: Older People Are 18.7% of Region’s Population, 33.3% of Region’s Pedestrian Deaths […]
[…] to the Columbia River Crossing, a highway megaproject that met its demise last week. Mobilizing the Region reports that older adults in the New York metropolitan region are particularly vulnerable to […]
[…] keep in mind that all pedestrians are not equally at risk: According to TSTC new report , Older pedestrians represent just 18.7 percent of the tri-state area population but account for […]