Note: In May 2012, TSTC published an analysis that examined pedestrian fatalities from 2008 through 2010 in Nassau County and Connecticut in relation to their proximity to Long Island Bus (now Nassau Inter-County Express) stops or CT Transit bus stops. This MTR post features a refined methodology, as well as information on 2011 pedestrian fatalities, the most up-to-date information available from the National Highway Traffic Safety Administration’s Fatality Analysis Reporting System database.
Getting to and from the bus stop shouldn’t be a dangerous activity, but for pedestrians in Connecticut and Nassau County, Long Island, it might be. In an examination of pedestrians killed by vehicles in Connecticut and Nassau County, TSTC found that large percentages – from 43 percent to almost 89 percent – of pedestrians killed by vehicles on roads where pedestrians are allowed were struck within 1/4 mile of a bus stop.
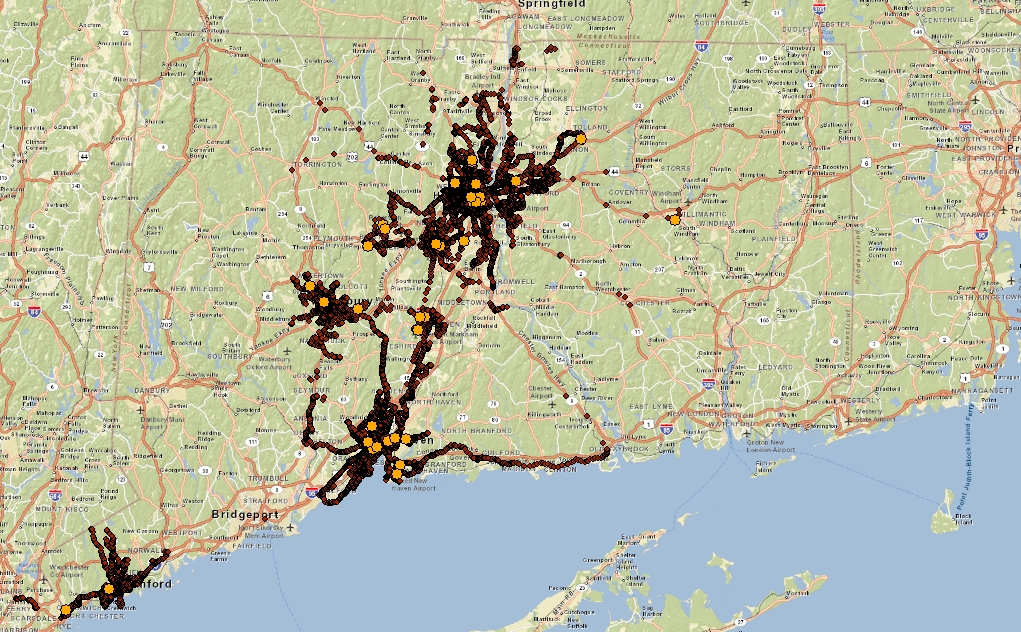
TSTC’s analysis of Connecticut pedestrian fatalities on roads where pedestrians are allowed shows that from 2009 through 2011, 43.2 percent of pedestrians killed by vehicles were killed within 1/4 mile of a CT Transit bus stop. Between 2008 and 2010, 54.1 percent of pedestrians killed by vehicles were killed within 1/4 mile of a CT Transit bus stop.
The analysis looks at six of CT Transit’s eight regional divisions: Hartford, New Haven, Stamford, New Britain, Waterbury and Meriden. (CT Transit was unable to provide bus stop information for its Bristol or Wallingford divisions.) Including CT Transit bus stops for Bristol and Wallingford, as well as information on bus stops in districts served by other transit agencies (such as Housatonic Area Regional Transit or Greater Bridgeport Transit), would likely increase the percentage of pedestrian fatalities located near transit.
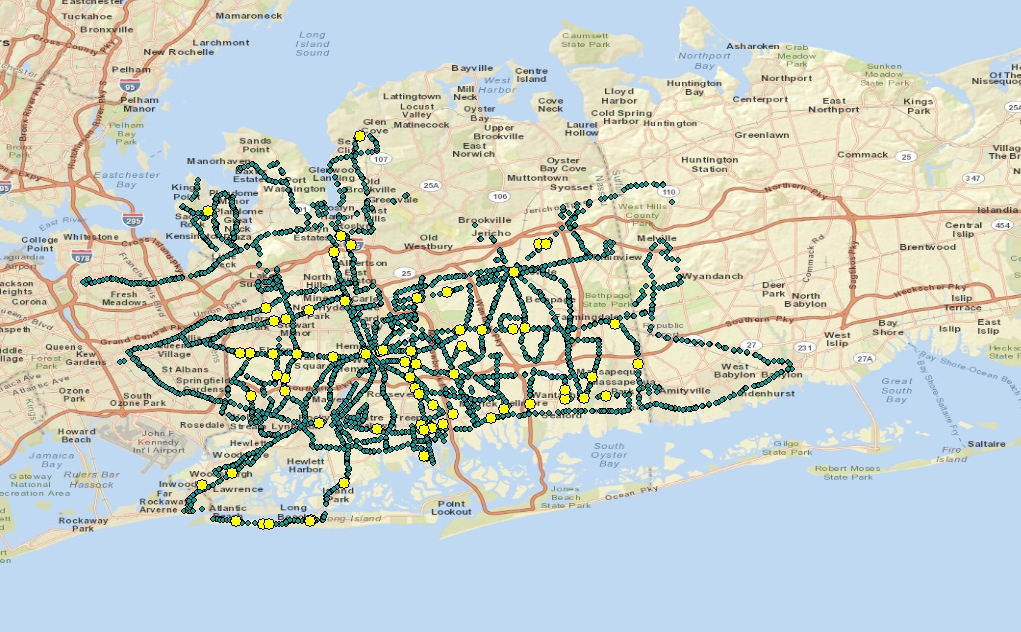
Looking at pedestrian fatalities that occurred within 1/4 mile of a Long Island Bus route[1] in Nassau County shows even more stark results: 88.5 percent of pedestrians killed by vehicles on roads where pedestrians are allowed were within 1/4 mile of a Long Island Bus stop from 2009 through 2011; 63.9 percent between 2008 and 2010.
It’s unclear whether most or any of these fatalities were transit riders, but every transit trip begins with a walking trip, and streets around bus stops or railroad stations tend to have more pedestrian activity — people waiting for a buses or headed to or from a transit facility — than streets without transit. State and municipal departments of transportation must ensure that streets around transit facilities are safe and accessible for pedestrians.
In its efforts to make Hempstead Turnpike safer for pedestrians, the New York State Department of Transportation and NICE have partnered to relocate certain bus stops along the corridor. This partnership can’t end here however, and NYSDOT should continue to work with NICE and Nassau County (and Suffolk County) to develop an Island-wide Safe Routes to Transit program, which would focus on pedestrian safety needs near transit. This partnership should go beyond bus stop relocations and identify additional traffic calming infrastructure that could enhance the safety of anyone who travels in the area—transit users, pedestrians, cyclists and motorists alike.
Connecticut can also do more to promote pedestrian safety at and around transit locations with a program similar to New Jersey DOT’s Safe Streets to Transit program, which targets grants to municipalities to make access to transit safer for pedestrians.
Pedestrians Killed by Vehicles, Connecticut
CT Transit bus stop file from CT Transit. Bus stop information is for Hartford, New Haven, Stamford, Waterbury, New Britain and Meriden. Data analyzed in ArcMap. Pedestrian fatality data from NHTSA’s FARS database.
2009-2011
| Number of pedestrians killed by vehicles on roads where pedestrians are allowed | 81 |
| Number of fatalities ¼ mile from a CT Transit bus stop | 35 |
| Percentage of pedestrians killed ¼ mile from a CT Transit bus stop | 43.2 % |
2008-2010
| Number of pedestrians killed by vehicles on roads where pedestrians are allowed | 98 |
| Number of fatalities ¼ mile from a CT Transit bus stop | 53 |
| Percentage of pedestrians killed ¼ mile from a CT Transit bus stop | 54.1 % |
Pedestrians Killed by Vehicles, Nassau County
Long Island Bus stop file from Steven Romalewski of Spatiality. Data analyzed in ArcMap. Pedestrian fatality data from NHTSA’s FARS database.
2009-2011
| Number of pedestrians killed by vehicles on roads where pedestrians are allowed | 78 |
| Number of fatalities ¼ mile from a LI Bus stop | 69 |
| Percentage of pedestrians killed ¼ mile from a LI Bus stop | 88.5 % |
2008-2010
| Number of pedestrians killed by vehicles on roads where pedestrians are allowed | 83 |
| Number of fatalities ¼ mile from a LI Bus stop | 53 |
| Percentage of pedestrians killed ¼ mile from a LI Bus stop | 63.9 % |
[1] Because up-to-date information in a mappable form on NICE Bus routes and bus stops is not publicly available, TSTC’s analysis uses Long Island Bus stop information from Steven Romalewski of Spatiality.
[…] on the Network today: Mobilizing the Region reports that transit riders Connecticut and Long Island appear to be at elevated risk of getting […]
Got to get rid of those Killer Bus Stops–Now!
I was surprised not to find any reference to transit users being hit while frantically trying to cross to catch a bus that comes only once every hour or half hour (or trying to cross to the other side after getting off a bus).
They mention a “safe routes to transit” program, based on a program for getting parents to let their kids walk to school. Why not consider transit buses being equipped with flashers and a law that requires drivers to stop in BOTH direction (like school buses) to allow a crossing “holiday” for a minute or two for each stop? Given the low frequency of service, it wouldn’t disrupt (motor) traffic that much.
Ottawa, Canada (My wife grew up on Long Island, and her mother never got a driver’s license).