2012’s just begun, and five people have already been killed in New Jersey car crashes.
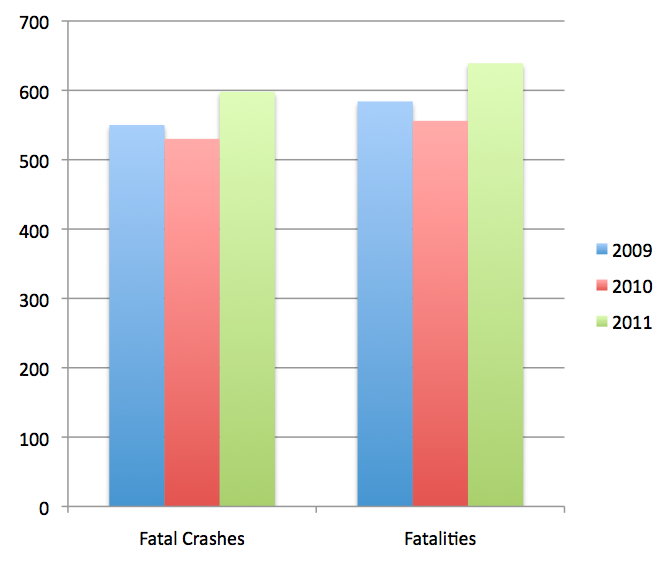
This spate of deaths comes after a bad year for vehicle safety in the Garden State: there were 13% more fatal motor vehicle crashes and 15.1% more motor vehicle fatalities in 2011 than in 2010. The New Jersey State Police reported 599 fatal accidents and 640 fatalities during the year.
Fatalities increased in every category: drivers, passengers, pedalcyclists and pedestrians. The percentage change of pedalcyclist fatalities was the highest due to the small number of pedalcyclist deaths (17 deaths in 2011 compared to 13 deaths in 2010, a 30.8% increase), but driver fatalities jumped a whopping 23.4% from 2010. Passenger fatalities increased by 4%, and pedestrian fatalities increased by 3.6%.
2011’s increase in fatal accidents and fatalities reverses a trend for the state—the numbers reached a peak in 2006, at 709 fatal crashes and 771 fatalities, and had been falling since 2007.
While motor vehicle fatalities can decrease with simple driver and passenger behaviors (wearing seatbelts and not talking or texting while driving), the fatality numbers show that we must continuously reexamine New Jersey’s roadways and work to make the streets safer for everyone.


[…] New Jersey Bucks Trend, Sees More Vehicle Deaths in 2011 (TSTC) […]
[…] 2010, pedestrian fatalities and injuries associated with these crashes increased. NJDOT data also show a slight increase in the state’s pedestrian fatalities during 2011. As gas prices increase and people turn to more […]