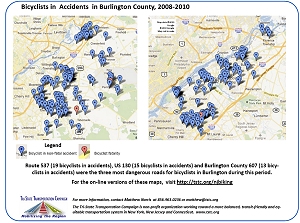
A new analysis from Tri-State has found that between 2001 and 2010, there were 7,830 bicycle crashes in crashes in eight Southern New Jersey counties (Atlantic, Burlington, Camden, Cape May, Cumberland, Gloucester, Ocean and Salem). During this period there were 60 fatal crashes.
Based on bicyclist crashes per capita, TSTC found that Cape May County is the most dangerous county for bicyclists, followed by Atlantic County and Cumberland County:
| Rank | County | Average Yearly Number of Bicycle Crashes, 2001-2010 | Average Population | Bicyclist Crash Rate per 10,000 Residents |
| 1 | Cape May | 80.6 | 99,796 | 8.08 |
| 2 | Atlantic | 133.1 | 263,551 | 5.05 |
| 3 | Cumberland | 60.4 | 151,668 | 3.98 |
| 4 | Ocean | 196.5 | 543,742 | 3.61 |
| 5 | Camden | 172.2 | 511,295 | 3.37 |
| 6 | Salem | 12.2 | 65,184 | 1.87 |
| 7 | Burlington | 81.2 | 436,064 | 1.86 |
| 8 | Gloucester | 46.8 | 271,481 | 1.72 |
| n/a | All Counties | 783 | 2,342,779 | 3.34 |
TSTC also conducted an analysis using data from 2008-2010 to determine particularly dangerous roadways for cyclists. The analysis shows that many accidents were clustered on specific roads. In addition, NJ 47 was one of Cape May, Cumberland and Gloucester Counties’ most dangerous roads.

Almost all of the dangerous roads were arterials, a type of road that TSTC has found to be the most dangerous for pedestrians in the region as well. Arterial roads typically have two or more lanes in each direction and allow for travel speeds of 40 mph or greater.
The analysis’s findings demonstrate the need for New Jersey to continue to examine the design of its streets, particularly the roads that have been shown to be hot spots for bicycle crashes. The percentage of bicycle crashes on these “hot spot” roads ranged from 13.4% to 29.9% of each county’s total bicycle crashes.
“There is a clear demand for safe cycling routes in the state, yet most roads are still designed for only cars in mind,” said Matthew Norris, Tri-State’s South Jersey Advocate. “We hope these numbers will help the New Jersey Department of Transportation and county officials fix these roadways to encourage healthier, more active lifestyles.”
NJDOT passed a statewide Complete Streets policy in December 2009 which requires new or rehabilitated roads to be built for all users, including walkers, cyclist, transit riders, and drivers.
County fact sheets and Google Maps can be found here.

[…] TSTC analyzed ten years of crash data from the New Jersey Department of […]
Your data of crashes per 10,000 residents is somewhat misleading. The top two counties, Cape May and Atlantic, are large summer tourist counties. Summer population, vehicular activity, (and, I assume, bicycle activity) soar.
Your county comparison data would be more useful if it could be seasonally adjusted.